In October 2026, the median sale price of a detached home on Johns Island rose 8.7 percent from October 2025, to $790,000. Over the same month, the average sale price rose 19.5 percent, to $969,902. Both figures cover the same 54 closings, recorded in the same month, in the same MLS area. Johns Island has two detached-home markets that share one set of statistics, which is why the two numbers moved at different speeds. The median describes the pond-front subdivisions where most homes are listed. The average also counts the high-end sales at the top.
If you are shopping the island, the useful question is which of those two markets the house in front of you belongs to. The answer changes which price history you should hold it against.
The gap between the two numbers doubled in a year
The Charleston Trident Association of Realtors' October 2026 Local Market Update for Johns Island, which covers MLS Area 23 and reflects data current as of November 9, puts the October 2025 detached median at $727,000 and the October 2025 average at $811,561. That is a gap of $84,561. In October 2026 the gap was $179,902.
A median is the price of the middle sale. Change the top sale from $2 million to $5 million and the median stays where it was. An average takes in every dollar, so a few large closings move it a long way. When the average rises more than twice as fast as the median, the likeliest explanation is more money at the top of the market. The typical house rose too, but by less.
The year-to-date figures, which cover a larger sample, show the same pattern. Through October 2026, the detached median was $729,740, up 4.2 percent from the first ten months of 2025. The year-to-date average was $922,990, up 11.7 percent. A single month's median rests on a few dozen sales, and CTAR's figures do not account for seller concessions. That makes the ten-month median the steadier guide to an ordinary house on the island. It also lines up closely with asking prices. On October 18, the median asking price across about 200 active residential listings on Johns Island was $729,995.
The October listing data shows the same split. The average asking price was $397 per square foot and the median was $304. A $93 difference between those two figures means the top of the list is a long way above the middle.
The middle of the market is a set of finished pond-front subdivisions
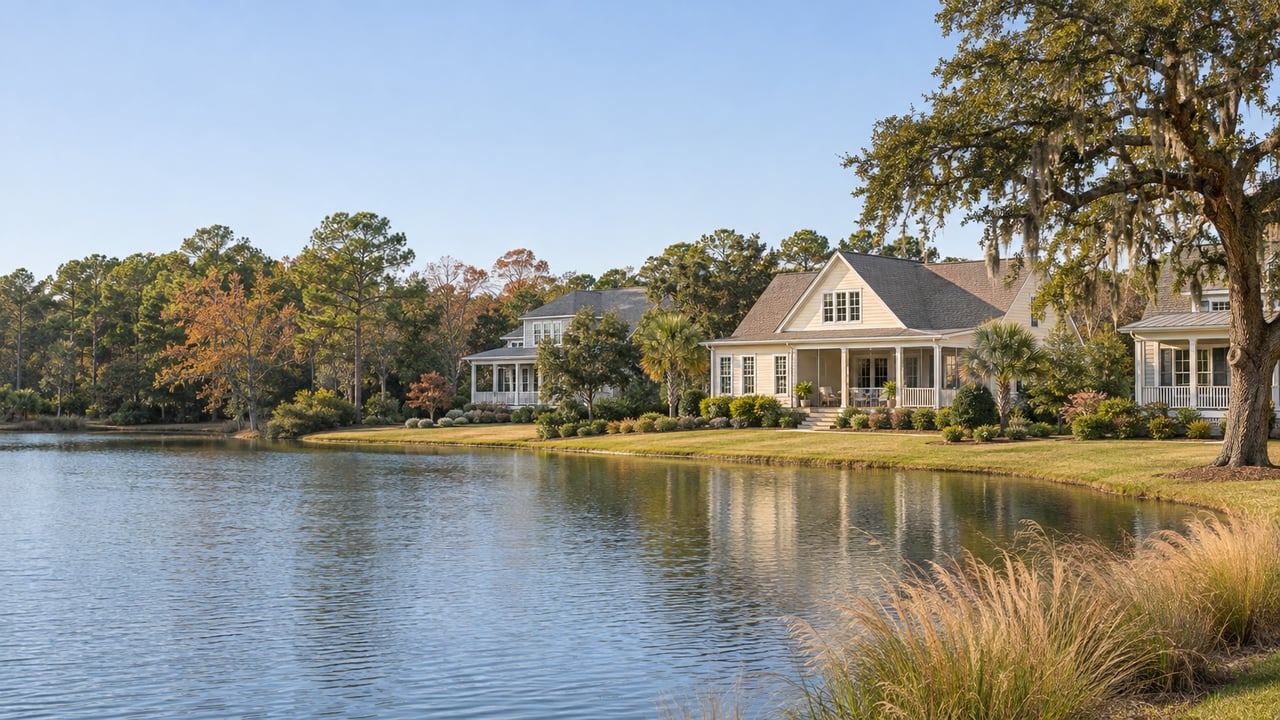
Look at where the listings were and the median stops being an abstraction. In the October 18 snapshot, the $500,000 to $750,000 band had the most homes for sale, with 64 listings, followed by 42 listings under $500,000. Oakfield, St. Johns Lake, Whitney Lake and Sea Island Preserve each had nine active listings. Pond-front homes, at 23, were the most common waterfront listing, ahead of 16 marshfront homes and 15 pond-site lots. The typical listed home had about 2,472 square feet and was built in 2012.
These are mostly communities whose builders have finished or are close to finishing:
- Oakfield opened in May 2017 and is complete at about 600 homes, built by Centex and Pulte across 17 floor plans. It is less than five minutes from the River Road and Maybank Highway intersection. Recent asking prices there run from about $525,000 to $825,000.
- Sea Island Preserve is listed as sold out on Pulte's community page, so the homes for sale there are resales.
- Whitney Lake was built by Sabal, CalAtlantic and Southeastern. Single-family asking prices there sit between about $550,000 and $630,000.
- Saint John's Lake is the one in this group still adding houses. Lennar is building 280 home sites there, and current asking prices run from about $630,000 to $775,000.
A home in any of these neighborhoods is valued against other homes like it: similar floor plans from the same builders, on similar ponds, a few streets apart. Its comparable sales are its neighbors, and those neighbors sit close to the island median. The 19.5 percent jump in the October average tells a buyer in Oakfield very little about the house on the next pond. If you are weighing new construction against a resale in one of these communities, our guide to buying new construction on Johns Island covers what is different about a builder contract.
Kiawah River prices on a separate scale
The high-end market is listed at prices well above the island median, and its largest single community is Kiawah River. Kiawah River is a 2,000-acre community on the Bohicket side of the island. Its developer currently lists detached homes from $1.735 million to $5.599 million and a villa at $1.55 million. Homesites there are listed from $275,000 to $3.25 million.
The current Kiawah River Builders Guild roster names 20 firms, among them Alair | Structures, Artisan Custom Homes, The Berry Group, Brightwater, Dolphin Architects + Builders, JacksonBuilt Custom Homes, Morgan-Keefe Builders, Riverland Builders, Saussy Burbank and Shelter Custom-Built Living. With that many builders and lot prices that far apart, two homes on the same street can differ in price by as much as entire subdivisions differ elsewhere on the island. Kiawah River had 13 active listings on October 18, more than any other subdivision on Johns Island.
Rural land is a third category, and it does not fit cleanly into either market. A 39.8-acre farm on the island is currently listed at $7.5 million, and a 0.30-acre lot in Tremont at $227,000. Each of those parcels is priced on its own terms, and neither tells you much about the island's homes.
| Segment | Where it sits | Price signal | Date of figure |
|---|---|---|---|
| Pond-front subdivisions, mostly finished | Oakfield, Whitney Lake, Sea Island Preserve, Saint John's Lake | Asking prices roughly $525,000 to $825,000; island detached median $729,740 | Current asks; CTAR year to date through October 2026 |
| High-end tier | Kiawah River | Homes $1.55 million to $5.599 million; homesites $275,000 to $3.25 million | Current developer listings |
| Acreage and lots | Scattered across the island | $227,000 lot to $7.5 million farm | Current asks, November 2026 |
Fewer listings heading into winter
Whichever segment you are shopping, there were fewer choices this fall. In October 2026, 55 detached homes were newly listed on Johns Island, compared with 92 in October 2025, a 40.2 percent drop. Inventory at month's end was 164 detached homes, down 14.1 percent. Closings rose slightly over the same period, from 52 to 54. Divide 164 homes by 54 closings and you get roughly three months of supply. CTAR does not publish that figure. It is our own arithmetic from its October numbers.
Fewer new listings has not yet meant faster sales. October's detached sellers received 95.5 percent of their original list price, and homes took 58 days to sell, up from 55 a year earlier. Through the first ten months of 2026, days on market averaged 49, up from 44 in 2025. Supply is tighter and buyers are still taking their time. In the pond-front subdivisions, a seller who lists at the right price for that neighborhood is competing with fewer houses than a year ago, while buyers still have room to negotiate.
By mid-November the active count had moved back up to 208 residential listings, with a median asking price of $696,200 and an average of 88 days on market. Those are asking-price figures for all residential listings, not closed sales.
Attached homes are a small market of their own. October's townhouse and condo median was $355,000 on 15 sales, while the year-to-date attached median was $449,700. With 15 sales, one or two closings can move the monthly figure a lot. The ten-month number is the more reliable read.
Proposed projects along Maybank Highway
Most of the island's finished subdivisions are close to the Maybank corridor, and new building along that road is coming in smaller pieces. On August 6, 2026, the City of Charleston's Technical Review Committee reviewed a 13.47-acre planned unit development and concept plan at 3298 Maybank Highway for the third time and returned it marked "Revise and Return." The same agenda included Live Oak Square, a multifamily site plan on Johns Island, which received the same result. Both projects are in the city's review process and are much smaller than a 600-home community like Oakfield.
Maybank Highway is also where Trident Health broke ground in September 2025 on a 12-bed freestanding emergency center, the first on Johns Island, as Count On 2 reported. If you are comparing addresses near the River Road intersection, the corridor's restaurant openings and closings show more of what changes on Maybank from year to year.
FAQ
Is $790,000 a fair benchmark for a typical Johns Island home? It was October 2026's detached median, based on 54 sales. The year-to-date median through October, $729,740, rests on 568 sales and is the steadier benchmark. Either figure is most useful in the pond-front subdivisions and least useful at Kiawah River.
Are Oakfield and Sea Island Preserve still selling new homes? Oakfield is complete at about 600 homes, and Pulte lists Sea Island Preserve as sold out. Homes for sale in both communities are resales. Saint John's Lake, where Lennar is building 280 sites, is the one in that group still adding houses.
Why compare a Kiawah River home to other Kiawah River homes instead of the island median? Its homesites alone are listed from $275,000 to $3.25 million, and the developer's home listings start at $1.55 million, so the island-wide median sits below every home on that list.
If you are deciding between a resale on an Oakfield pond and a homesite at Kiawah River, or are preparing to sell on the island and want to know which comparable sales your home will be measured against, St. Germain Properties can go through the Johns Island sales in your segment with you, one subdivision at a time. Start with our Johns Island neighborhood page or a home valuation, then Request a Private Consultation.